Market Outlook
November 30, 2016
Market Cues
Domestic Indices
Chg (%)
(Pts)
(Close)
Indian market is expected to open on a flat note tracking the SGX Nifty.
BSE Sensex
0.2
44
26,394
The US markets closed higher on Tuesday but below record highs as better-than-
Nifty
0.2
15
8,142
expected economic reports were tempered by a drop in oil prices. The Dow Jones
Mid Cap
0.5
66
12,367
Industrial Average rose 0.1%, to close at 19,122. The S&P 500 index advanced
Small Cap
0.6
67
12,174
0.1% to finish at 2,205 with health-care and real-estate the strongest sectors.
Bankex
(0.4)
(82)
20,857
Oil companies weighed on the London market as energy shares were hit by a fall in
oil prices ahead of the meeting of OPEC oil producers on Wednesday. At close, the
Global Indices
Chg (%)
(Pts)
(Close)
benchmark FTSE 100 index was down 0.4% at 6,772.
Dow Jones
0.12
24
19,122
Rising for the third straight session, benchmark Sensex gained about 44 points to
Nasdaq
0.21
11
5,380
close at over two-week high of 26,394 on gains in select blue chips. Sentiment
FTSE
(0.4)
(27)
6,772
remained upbeat for the better part of the day after the government yesterday
provided yet another opportunity to black money holders to legalise their wealth.
Nikkei
(0.3)
(50)
18,307
RBI had yesterday said lenders had received `8.45 lakh crore ($123.07 billion) in
Hang Seng
(0.4)
(93)
22,737
deposits, a substantial amount of the notes that were declared worthless earlier this
Shanghai Com
0.2
6
3,283
month. The Nifty 50 of NSE closed up 0.19%, to 8,142.
Advances / Declines
BSE
NSE
News Analysis
Advances
1,581
1,030
Airtel, Brookfield in talks for Bharti Infratel stake sale
Detailed analysis on Pg2
Declines
1,035
594
Unchanged
200
53
Investor’s Ready Reckoner
Key Domestic & Global Indicators
Volumes (` Cr)
Stock Watch: Latest investment recommendations on 150+ stocks
BSE
2,876
Refer Pg5 onwards
NSE
18,680
Top Picks
CMP
Target
Upside
Company
Sector
Rating
Net Inflows (` Cr)
Net
Mtd
Ytd
(`)
(`)
(%)
Amara Raja BatteriesAuto & Auto Ancill.
Buy
929
1,167
25.6
FII
(1,367)
(16,724)
28,291
HCL Tech
IT
Buy
806
1,000
24.1
MFs
945
11,650
33,703
Asian Granito
Capital Goods
Buy
210
351
67.5
Equitas Holdings
Financials
Buy
159
235
47.5
Top Gainers
Price (`)
Chg (%)
Navkar Corporation Others
Buy
172
265
53.7
Muthootfin
308
7.9
More Top Picks on Pg3
Bharatfin
734
7.9
Key Upcoming Events
Bergepaint
241
7.0
Previous
Consensus
Date
Region
Event Description
Reading
Expectations
Manappuram
76
5.5
Nov 30 US
Consumer Confidence
98.60
101.50
Eichermot
21,343
5.5
Dec 1 US
Initial Jobless claims
251.00
253.00
Dec 1 China
PMI Manufacturing
51.20
51.00
Top Losers
Price (`)
Chg (%)
Dec 1 Germany PMI Manufacturing
54.40
54.40
Mrpl
98
(3.6)
Dec 1 UK
PMI Manufacturing
54.30
54.40
More Events on Pg4
Oberoirlty
275
(3.4)
Tubeinvest
568
(3.3)
Cox&Kings
163
(3.3)
Raymond
498
(3.2)
As on November 29, 2016
Market Outlook
November 30, 2016
News Analysis
Airtel, Brookfield in talks for Bharti Infratel stake sale
Brookfield Asset Management has submitted the highest bid for a 51% stake in
telecom tower service provider Bharti Infratel and started exclusive talks with the
company’s promoters Bharti Airtel. Brookfield, which manages $250 billion assets
worldwide, beat a consortium of US-based private equity (PE) funds KKR & Co. and
Blackstone Group LP, and Canada Pension Plan Investment Board (CPPIB) to
submit the highest bid.
Bharti Airtel owns 71.7% in Infratel, while the rest is held by public shareholders.
Bharti Infratel had consolidated revenue of $1.8 billion in 2015-16.
Bharti Infratel had a market value of about $10bn as on 29 November and a 51%
share will be valued at about $5 billion. On 25 October, the Bharti Airtel board
had approved the sale of a significant stake in Infratel.
Bharti Infratel owns 42% in Indus Towers—India’s largest telecom tower company
which is a joint venture of Bharti Infratel, Vodafone India Ltd and Aditya Birla
Telecom (Idea Cellular). Bharti Infratel owns 89,791 towers, 38,832 of its own and
50,959 towers represented by the 42% stake in Indus Towers.
Last month, Brookfield agreed to buy a 51% stake in Reliance Infratel, the mobile
phone tower asset of Anil Ambani-owned Reliance Communications for `11,000cr
in cash.
The deal helped reduce RCom’s debt, the most indebted mobile phone service
provider in India with a debt of about `42,000cr.
Economic and Political News
Microfinance firms stops lending in Uttar Pradesh
`4Lakh cr debt risks being written off': Ind-Ra.
Adaptive Indian economy will overcome note ban
RBI rate cut likely in December monetary policy review
Lok Sabha passes IT Act amendment to tax unexplained deposits
Corporate News
Malaysia's Axiata may hang up on Idea Cellular stake
Tata Steel may lose a high margin business with sale of speciality business
Jet Airways decides to put network expansion over market share
Taj ties up with Shangri-La in bid to expand global footprint
LIC starts prepping to vote in Tata EGMs called for Cyrus Mistry ouster
Market Outlook
November 30, 2016
Top Picks ★★★★★
Large Cap
Market Cap
CMP
Target
Upside
Company
Rationale
(` Cr)
(`)
(`)
(%)
To outpace battery industry growth due to better
Amara Raja Batteries
15,867
929
1,167
25.6
technological products leading to market share gains in both
the automotive OEM and replacement segments.
The stock is trading at attractive valuations and is factoring
HCL Tech
1,13,658
806
1,000
24.1
all the bad news.
Back on the growth trend; expect a long term growth of 14%
Infosys
2,23,412
973
1,249
28.4
to be a US$20bn in FY2020.
Source: Company, Angel Research
Mid Cap
Market Cap
CMP
Target
Upside
Company
Rationale
(` Cr)
(`)
(`)
(%)
We expect the company would report strong profitability
Asian Granito
630
210
351
67.5
owing to better product mix, higher B2C sales and
amalgamation synergy.
Among the top 4 players in the consumer durables segment.
Bajaj Electricals
2,188
217
274
26.4
Improved profitability backed by turn around in E&P segment.
Strong order book lends earnings visibility.
Favourable outlook for the AC industry to augur well for
Cooling products business which is out pacing the market
Blue Star
4,518
474
634
33.8
growth. EMPPAC division's profitability to improve once
operating environment turns around.
With a focus on the low and medium income (LMI) consumer
Dewan Housing Finance
7,866
251
350
39.3
segment, the company has increased its presence in tier-II &
III cities where the growth opportunity is immense.
Strong loan growth backed by diversified loan portfolio and
Equitas Holdings
5,343
159
235
47.5
adequate CAR. ROE & ROA likely to remain decent as risk of
dilution remains low. Attractive valuations considering growth.
Economic recovery to have favourable impact on advertising
& circulation revenue growth. Further, the acquisition of a
Jagran Prakashan
5,616
172
225
31.0
radio business (Radio City) would also boost the company's
revenue growth.
Speedier execution and speedier sales, strong revenue visibilty
Mahindra Lifespace
1,535
374
522
39.6
in short-to-long run, attractive valuations
We expect the company to report strong growth on back of
healthy growth in domestic branded sales (owing to
Mirza International
973
81
107
32.3
aggressive ad spend and addition in the number of EBOs &
multi-brand outlets [MBOs]) and healthy export revenues.
Massive capacity expansion along with rail advantage at ICD
Navkar Corporation
2,459
172
265
53.7
as well CFS augurs well for the company.
Strong brands and distribution network would boost growth
Siyaram Silk Mills
1,143
1,219
1,605
31.7
going ahead. Stock currently trades at an inexpensive
valuation.
Market leadership in Hindi news genre and no. 2 viewership
ranking in English news genre, exit from the radio business,
TV Today Network
1,849
310
385
24.2
and anticipated growth in ad spends by corporate to benefit
the stock.
Source: Company, Angel Research
Market Outlook
November 30, 2016
Key Upcoming Events
Global economic events release calendar
Bloomberg Data
Date
Time
Country
Event Description
Unit
Period
Last Reported
Estimated
Nov 30, 2016
8:30 PM
US
Consumer ConfidenceS.A./ 1985=100
Nov
98.60
101.50
Dec 01, 2016
7:00 PM
US
Initial Jobless claims
Thousands
Nov 26
251.00
253.00
6:30 AM
China
PMI Manufacturing
Value
Nov
51.20
51.00
2:25 PM
Germany
PMI Manufacturing
Value
Nov F
54.40
54.40
3:00 PM
UK
PMI Manufacturing
Value
Nov
54.30
54.40
Dec 02, 2016
7:00 PM
US
Change in Nonfarm payrolls
Thousands
Nov
161.00
180.00
7:00 PM
US
Unnemployment rate
% Nov
4.90
4.90
Dec 05, 2016
2:25 PM
Germany
PMI Services
Value
Nov F
55.00
Dec 06, 2016
3:30 PM Euro Zone
Euro-Zone GDP s.a. (QoQ)
% Change
3Q F
0.30
Dec 07, 2016
3:00 PM
UK
Industrial Production (YoY)
% Change
Oct
0.30
2:30 PM
India
RBI Reverse Repo rate
%
Dec 7
5.75
2:30 PM
India
RBI Repo rate
%
Dec 7
6.25
2:30 PM
India
RBI Cash Reserve ratio
%
Dec 7
4.00
Dec 08, 2016
China
Exports YoY%
% Change
Nov
(7.30)
(6.60)
India
Imports YoY%
% Change
Nov
8.10
Dec 09, 2016
6:15 PM Euro Zone
ECB announces interest rates
%
Dec 8
-
India
Exports YoY%
% Change
Nov
9.59
7:00 AM
China
Consumer Price Index (YoY)
% Change
Nov
2.10
2.20
Dec 12, 2016
5:30 PM
India
Industrial Production YoY
% Change
Oct
0.70
Dec 13, 2016
3:00 PM
UK
CPI (YoY)
% Change
Nov
0.90
7:30 AM
China
Industrial Production (YoY)
% Change
Nov
6.10
Dec 14, 2016
3:00 PM
UK
Jobless claims change
% Change
Nov
9.80
7:45 PM
US
Industrial Production
% Nov
0.04
US
Producer Price Index (mom)
% Change
Nov
0.40
Source: Bloomberg, Angel Research
Market Outlook
November 30, 2016
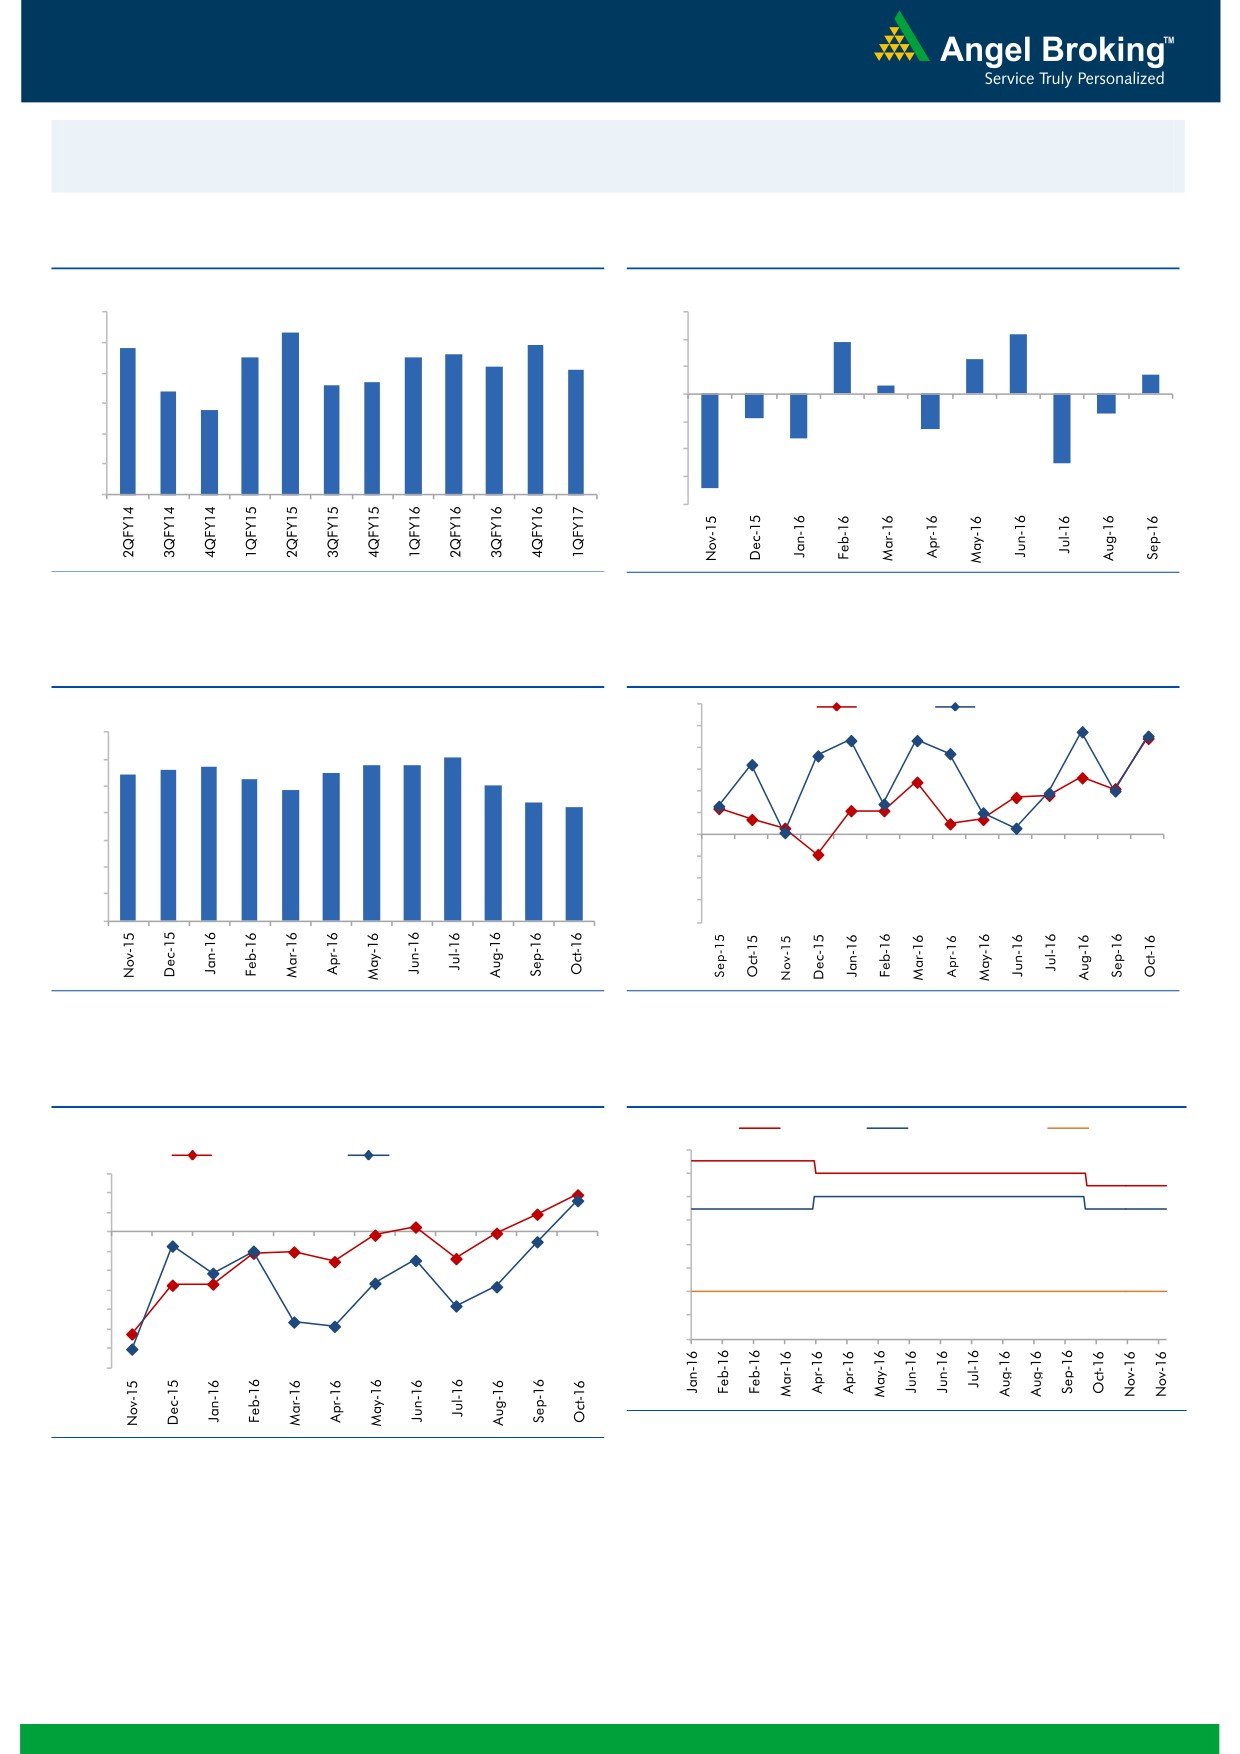
Macro watch
Exhibit 1: Quarterly GDP trends
Exhibit 2: IIP trends
(%)
(%)
9.0
3.0
8.3
2.2
7.9
1.9
7.8
8.0
7.5
7.5
7.6
2.0
1.3
7.2
7.1
0.7
6.6
6.7
1.0
0.3
7.0
6.4
5.8
-
6.0
(1.0)
5.0
(0.9)
(0.7)
(2.0)
(1.3)
(1.6)
4.0
(3.0)
(2.5)
3.0
(4.0)
(3.4)
Source: CSO, Angel Research
Source: MOSPI, Angel Research
Exhibit 3: Monthly CPI inflation trends
Exhibit 4: Manufacturing and services PMI
56.0
Mfg. PMI
Services PMI
(%)
55.0
7.0
6.1
5.7
5.8
5.8
54.0
6.0
5.4
5.6
5.5
5.3
5.1
53.0
4.8
5.0
4.4
4.2
52.0
4.0
51.0
3.0
50.0
49.0
2.0
48.0
1.0
47.0
-
46.0
Source: MOSPI, Angel Research
Source: Market, Angel Research; Note: Level above 50 indicates expansion
Exhibit 5: Exports and imports growth trends
Exhibit 6: Key policy rates
c
(%)
Repo rate
Reverse Repo rate
CRR
7.00
(%)
Exports yoy growth
Imports yoy growth
15.0
6.50
10.0
6.00
5.0
5.50
0.0
5.00
(5.0)
(10.0)
4.50
(15.0)
4.00
(20.0)
3.50
(25.0)
3.00
(30.0)
(35.0)
Source: RBI, Angel Research
Source: Bloomberg, Angel Research
Market Outlook
November 30, 2016
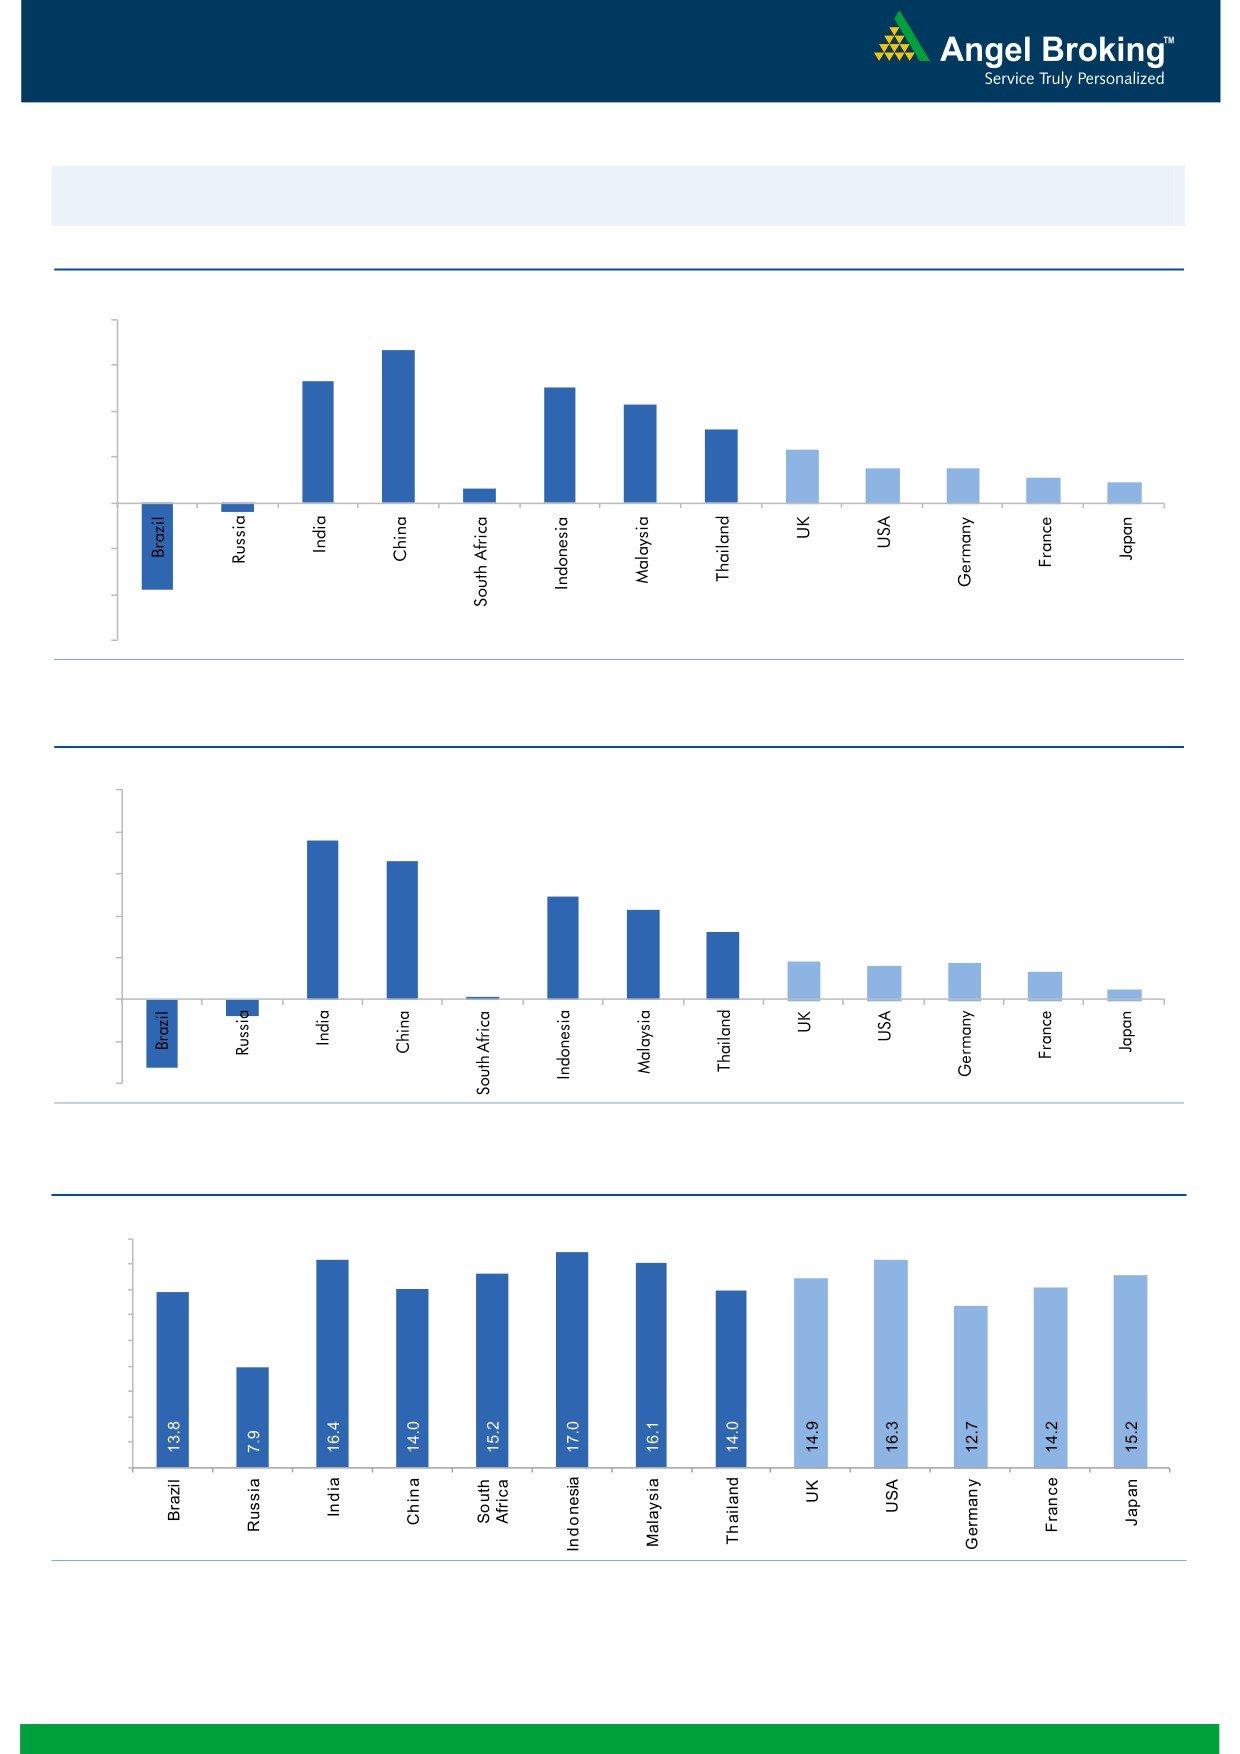
Global watch
Exhibit 1: Latest quarterly GDP Growth (%, yoy) across select developing and developed countries
(%)
8.0
6.7
6.0
5.3
0.6
5.0
4.3
4.0
3.2
2.3
1.5
1.5
2.0
1.1
0.9
-
(2.0)
(0.4)
(4.0)
(3.8)
(6.0)
Source: Bloomberg, Angel Research
Exhibit 2: 2016 GDP Growth projection by IMF (%, yoy) across select developing and developed countries
(%)
10.0
7.6
8.0
6.6
6.0
4.9
4.3
4.0
3.2
1.8
1.7
1.6
1.3
2.0
(0.8)
0.5
(3.3)
0.1
-
(2.0)
(4.0)
Source: IMF, Angel Research
Exhibit 3: One year forward P-E ratio across select developing and developed countries
(x)
18.0
16.0
14.0
12.0
10.0
8.0
6.0
4.0
2.0
-
Source: IMF, Angel Research
Market Outlook
November 30, 2016
Exhibit 4: Relative performance of indices across globe
Returns (%)
Country
Name of index
Closing price
1M
3M
1YR
Brazil
Bovespa
60,987
(4.4)
5.7
26.3
Russia
Micex
2,087
5.4
5.1
16.2
India
Nifty
8,142
(5.5)
(5.9)
3.6
China
Shanghai Composite
3,283
5.3
5.6
(10.1)
South Africa
Top 40
43,603
(1.6)
(5.7)
(5.9)
Mexico
Mexbol
45,372
(5.1)
(4.2)
3.2
Indonesia
LQ45
856
(7.2)
(7.0)
9.2
Malaysia
KLCI
1,627
(2.6)
(3.2)
(2.6)
Thailand
SET 50
932
(0.7)
(5.1)
5.6
USA
Dow Jones
19,122
5.2
3.3
6.9
UK
FTSE
6,772
(3.2)
(0.1)
5.5
Japan
Nikkei
18,307
5.3
10.3
(6.8)
Germany
DAX
10,620
(0.7)
(0.3)
(5.1)
France
CAC
4,551
0.1
2.6
(2.8)
Source: Bloomberg, Angel Research
Stock Watch
November 30, 2016
Company Name
Reco
CMP
Target
Mkt Cap
Sales ( Čcr )
OPM(%)
EPS (Č)
PER(x)
P/BV(x)
RoE(%)
EV/Sales(x)
(Č)
Price ( Č)
( Č cr )
FY17E FY18E
FY17E
FY18E
FY17E
FY18E
FY17E
FY18E
FY17E
FY18E
FY17E
FY18E
FY17E
FY18E
Agri / Agri Chemical
Rallis
Neutral
206
-
4,010
1,937
2,164
13.3
14.3
9.0
11.0
22.9
18.8
4.0
3.5
18.4
19.8
2.1
1.9
United Phosphorus
Accumulate
625
684
31,685
15,176
17,604
18.5
18.5
37.4
44.6
16.7
14.0
3.3
2.7
21.4
21.2
2.2
1.9
Auto & Auto Ancillary
Ashok Leyland
Buy
80
111
22,767
22,407
26,022
10.6
10.6
5.2
6.4
15.3
12.5
3.5
2.9
23.6
24.7
1.1
0.9
Bajaj Auto
Neutral
2,662
-
77,024
25,093
27,891
19.5
19.2
143.9
162.5
18.5
16.4
5.2
4.5
30.3
29.4
2.8
2.4
Bharat Forge
Neutral
902
-
20,990
7,726
8,713
20.5
21.2
35.3
42.7
25.5
21.1
4.7
4.3
18.9
20.1
2.8
2.4
Eicher Motors
Neutral
21,294
-
57,837
16,583
20,447
17.5
18.0
598.0
745.2
35.6
28.6
12.2
9.3
41.2
38.3
3.3
2.6
Gabriel India
Buy
109
130
1,566
1,544
1,715
9.0
9.3
5.4
6.3
20.2
17.3
3.8
3.4
18.9
19.5
1.0
0.9
Hero Motocorp
Accumulate
3,160
3,541
63,102
30,958
34,139
15.7
15.7
193.6
208.3
16.3
15.2
6.4
5.3
34.2
30.5
1.9
1.7
Jamna Auto Industries Neutral
178
-
1,418
1,486
1,620
9.8
9.9
15.0
17.2
11.8
10.3
2.6
2.2
21.8
21.3
1.0
0.9
L G Balakrishnan & Bros Neutral
585
-
918
1,302
1,432
11.6
11.9
43.7
53.0
13.4
11.0
1.9
1.7
13.8
14.2
0.8
0.7
Mahindra and Mahindra Neutral
1,187
-
73,721
46,534
53,077
11.6
11.7
67.3
78.1
17.6
15.2
2.9
2.5
15.4
15.8
1.6
1.3
Maruti
Buy
5,091
6,006
153,784
68,057
82,958
15.8
15.5
212.1
261.2
24.0
19.5
4.8
4.0
19.8
20.3
1.9
1.5
Minda Industries
Neutral
304
-
2,410
2,728
3,042
9.0
9.1
68.2
86.2
4.5
3.5
1.0
0.8
23.8
24.3
0.9
0.8
Motherson Sumi
Neutral
304
-
42,628
45,896
53,687
7.8
8.3
13.0
16.1
23.3
18.9
7.5
6.0
34.7
35.4
1.0
0.8
Rane Brake Lining
Neutral
977
-
773
511
562
11.3
11.5
28.1
30.9
34.8
31.6
5.3
4.8
15.3
15.0
1.7
1.5
Setco Automotive
Neutral
38
-
511
741
837
13.0
13.0
15.2
17.0
2.5
2.3
0.4
0.4
15.8
16.3
1.1
1.0
Tata Motors
Neutral
460
-
132,754
300,209
338,549
8.9
8.4
42.7
54.3
10.8
8.5
1.7
1.5
15.6
17.2
0.6
0.5
TVS Motor
Neutral
359
-
17,037
13,390
15,948
6.9
7.1
12.8
16.5
28.1
21.7
7.0
5.5
26.3
27.2
1.3
1.1
Amara Raja Batteries
Buy
929
1,167
15,867
5,504
6,605
18.4
19.8
33.4
40.9
27.8
22.7
6.1
5.0
22.1
22.0
2.9
2.4
Exide Industries
Neutral
178
-
15,160
7,439
8,307
15.0
15.0
8.1
9.3
22.0
19.2
3.1
2.8
14.3
16.7
1.7
1.5
Apollo Tyres
Buy
184
235
9,353
12,877
14,504
14.3
13.9
21.4
23.0
8.6
8.0
1.3
1.2
16.4
15.2
0.9
0.8
Ceat
Buy
1,219
1,450
4,932
7,524
8,624
13.0
12.7
131.1
144.3
9.3
8.5
1.7
1.5
19.8
18.6
0.7
0.6
JK Tyres
Neutral
117
-
2,659
7,455
8,056
15.0
15.0
21.8
24.5
5.4
4.8
1.1
0.9
22.8
21.3
0.5
0.4
Swaraj Engines
Neutral
1,333
-
1,656
660
810
15.2
16.4
54.5
72.8
24.5
18.3
7.6
6.9
31.5
39.2
2.3
1.9
Subros
Neutral
163
-
975
1,488
1,681
11.7
11.9
6.4
7.2
25.4
22.7
2.7
2.4
10.8
11.4
0.9
0.8
Indag Rubber
Neutral
180
-
471
286
326
19.8
16.8
11.7
13.3
15.4
13.5
2.6
2.4
17.8
17.1
1.3
1.1
Capital Goods
ACE
Neutral
48
-
473
709
814
4.1
4.6
1.4
2.1
34.2
22.8
1.4
1.3
4.4
6.0
0.8
0.7
BEML
Neutral
835
-
3,476
3,451
4,055
6.3
9.2
31.4
57.9
26.6
14.4
1.6
1.5
6.3
10.9
1.1
0.9
Bharat Electronics
Neutral
1,407
-
31,434
8,137
9,169
16.8
17.2
58.7
62.5
24.0
22.5
3.7
3.3
44.6
46.3
2.8
2.6
Stock Watch
November 30, 2016
Company Name
Reco
CMP
Target
Mkt Cap
Sales ( Čcr )
OPM(%)
EPS (Č)
PER(x)
P/BV(x)
RoE(%)
EV/Sales(x)
(Č)
Price ( Č)
( Č cr )
FY17E
FY18E
FY17E
FY18E
FY17E
FY18E
FY17E
FY18E
FY17E
FY18E
FY17E
FY18E
FY17E
FY18E
Capital Goods
Voltas
Buy
307
407
10,170
6,511
7,514
7.9
8.7
12.9
16.3
23.8
18.9
4.3
3.8
16.7
18.5
1.3
1.1
BGR Energy
Neutral
110
-
797
16,567
33,848
6.0
5.6
7.8
5.9
14.2
18.7
0.8
0.8
4.7
4.2
0.2
0.1
BHEL
Neutral
129
-
31,684
28,797
34,742
-
2.8
2.3
6.9
56.3
18.8
1.0
0.9
1.3
4.8
0.8
0.5
Blue Star
Buy
474
634
4,518
4,283
5,077
5.9
7.3
14.9
22.1
31.8
21.4
6.2
5.2
20.4
26.4
1.1
0.9
Crompton Greaves
Neutral
74
-
4,629
5,777
6,120
5.9
7.0
3.3
4.5
22.4
16.4
1.0
0.9
4.4
5.9
0.8
0.6
Greaves Cotton
Neutral
126
-
3,065
1,755
1,881
16.8
16.9
7.8
8.5
16.1
14.8
3.2
3.0
20.6
20.9
1.4
1.3
Inox Wind
Neutral
186
-
4,130
5,605
6,267
15.7
16.4
24.8
30.0
7.5
6.2
2.1
1.5
25.9
24.4
0.8
0.6
KEC International
Neutral
143
-
3,665
9,294
10,186
7.9
8.1
9.9
11.9
14.4
12.0
2.1
1.8
15.6
16.3
0.6
0.6
Thermax
Neutral
832
-
9,915
5,421
5,940
7.3
7.3
25.7
30.2
32.4
27.6
3.9
3.6
12.2
13.1
1.7
1.6
VATech Wabag
Buy
500
681
2,724
3,136
3,845
8.9
9.1
26.0
35.9
19.2
13.9
2.4
2.1
13.4
15.9
0.8
0.6
Cement
ACC
Neutral
1,323
-
24,836
11,225
13,172
13.2
16.9
44.5
75.5
29.7
17.5
2.8
2.6
11.2
14.2
2.2
1.9
Ambuja Cements
Neutral
205
-
40,755
9,350
10,979
18.2
22.5
5.8
9.5
35.4
21.6
3.0
2.7
10.2
12.5
4.4
3.7
India Cements
Neutral
117
-
3,592
4,364
4,997
18.5
19.2
7.9
11.3
14.8
10.4
1.1
1.0
8.0
8.5
1.6
1.4
JK Cement
Neutral
734
-
5,135
4,398
5,173
15.5
17.5
31.2
55.5
23.5
13.2
2.8
2.5
12.0
15.5
1.7
1.4
J K Lakshmi Cement
Buy
376
565
4,422
2,913
3,412
14.5
19.5
7.5
22.5
50.1
16.7
3.1
2.6
12.5
18.0
2.1
1.8
Orient Cement
Buy
132
215
2,712
2,114
2,558
18.5
20.5
8.1
11.3
16.4
11.7
2.4
2.0
9.0
14.0
1.9
1.5
UltraTech Cement
Neutral
3,537
-
97,078
25,768
30,385
21.0
23.5
111.0
160.0
31.9
22.1
4.1
3.6
13.5
15.8
3.9
3.2
Construction
ITNL
Neutral
102
-
3,350
8,946
10,017
31.0
31.6
8.1
9.1
12.6
11.2
0.5
0.5
4.2
5.0
3.7
3.4
KNR Constructions
Accumulate
725
802
2,039
1,385
1,673
14.7
14.0
41.2
48.5
17.6
15.0
3.3
2.8
14.9
15.2
1.6
1.3
Larsen & Toubro
Buy
1,355
1,700
126,245
67,665
77,249
10.7
11.5
57.3
71.2
23.6
19.0
2.2
2.0
12.6
14.3
2.0
1.8
Gujarat Pipavav Port
Neutral
141
-
6,821
705
788
52.2
51.7
5.0
5.6
28.2
25.2
2.8
2.5
11.2
11.2
9.3
7.9
Nagarjuna Const.
Neutral
81
-
4,492
8,842
9,775
9.1
8.8
5.3
6.4
15.3
12.6
1.2
1.1
8.2
9.1
0.7
0.6
PNC Infratech
Buy
109
143
2,804
2,350
2,904
13.1
13.2
9.0
8.8
12.1
12.4
0.4
0.4
15.9
13.9
1.3
1.1
Simplex Infra
Neutral
307
-
1,519
6,829
7,954
10.5
10.5
31.4
37.4
9.8
8.2
1.0
0.9
9.9
13.4
0.6
0.5
Power Mech Projects
Neutral
469
-
689
1,801
2,219
12.7
14.6
72.1
113.9
6.5
4.1
1.2
1.0
16.8
11.9
0.4
0.3
Sadbhav Engineering
Accumulate
273
298
4,689
3,598
4,140
10.3
10.6
9.0
11.9
30.4
23.0
3.2
2.8
9.9
11.9
1.6
1.4
NBCC
Neutral
227
-
13,617
7,428
9,549
7.9
8.6
8.2
11.0
27.7
20.6
1.4
1.1
28.2
28.7
1.5
1.1
MEP Infra
Neutral
37
-
597
1,877
1,943
30.6
29.8
3.0
4.2
12.3
8.8
5.9
4.0
0.6
0.6
1.7
1.5
SIPL
Neutral
89
-
3,149
1,036
1,252
65.5
66.2
(8.4)
(5.6)
3.4
3.8
(22.8)
(15.9)
11.3
9.4
Stock Watch
November 30, 2016
Company Name
Reco
CMP
Target
Mkt Cap
Sales ( Čcr )
OPM(%)
EPS (Č)
PER(x)
P/BV(x)
RoE(%)
EV/Sales(x)
(Č)
Price ( Č)
( Č cr )
FY17E
FY18E
FY17E
FY18E
FY17E
FY18E
FY17E
FY18E
FY17E
FY18E
FY17E
FY18E
FY17E
FY18E
Construction
Engineers India
Neutral
293
-
9,882
1,725
1,935
16.0
19.1
11.4
13.9
25.7
21.1
3.6
3.4
13.4
15.3
4.7
4.2
Financials
Axis Bank
Buy
465
630
111,056
46,932
53,575
3.5
3.4
32.4
44.6
14.4
10.4
1.9
1.6
13.6
16.5
-
-
Bank of Baroda
Neutral
162
-
37,281
19,980
23,178
1.8
1.8
11.5
17.3
14.1
9.4
1.6
1.3
8.3
10.1
-
-
Canara Bank
Neutral
311
-
16,882
15,225
16,836
1.8
1.8
14.5
28.0
21.4
11.1
1.5
1.2
5.8
8.5
-
-
Dewan Housing Finance Buy
251
350
7,866
2,225
2,688
2.9
2.9
29.7
34.6
8.5
7.3
1.4
1.2
16.1
16.8
-
-
Equitas Holdings
Buy
159
235
5,343
939
1,281
11.7
11.5
5.8
8.2
27.5
19.4
2.4
2.1
10.9
11.5
-
-
Federal Bank
Neutral
70
-
11,959
9,353
10,623
2.9
2.9
4.4
5.8
15.8
12.0
1.5
1.3
9.5
11.0
-
-
HDFC
Neutral
1,256
-
198,490
11,475
13,450
3.4
3.4
45.3
52.5
27.7
23.9
5.3
4.7
20.2
20.5
-
-
HDFC Bank
Accumulate
1,179
1,350
298,505
46,097
55,433
4.5
4.5
58.4
68.0
20.2
17.3
3.5
3.0
18.8
18.6
-
-
ICICI Bank
Buy
256
315
148,825
42,800
44,686
3.1
3.3
18.0
21.9
14.2
11.7
1.9
1.8
11.1
12.3
-
-
LIC Housing Finance
Buy
545
630
27,504
3,712
4,293
2.6
2.5
39.0
46.0
14.0
11.9
2.6
2.2
19.9
20.1
-
-
Punjab Natl.Bank
Neutral
136
-
28,983
23,532
23,595
2.3
2.4
6.8
12.6
20.0
10.8
3.1
2.2
3.3
6.5
-
-
RBL Bank
Neutral
360
-
13,300
1,783
2,309
2.6
2.6
12.7
16.4
28.3
21.9
3.1
2.8
12.8
13.3
-
-
South Ind.Bank
Neutral
21
-
2,836
6,435
7,578
2.5
2.5
2.7
3.1
7.8
6.8
1.0
0.8
10.1
11.2
-
-
St Bk of India
Neutral
253
-
196,359
88,650
98,335
2.6
2.6
13.5
18.8
18.7
13.5
1.8
1.6
7.0
8.5
-
-
Union Bank
Neutral
149
-
10,260
13,450
14,925
2.3
2.3
25.5
34.5
5.9
4.3
0.9
0.7
7.5
10.2
-
-
Yes Bank
Neutral
1,144
-
48,171
8,978
11,281
3.3
3.4
74.0
90.0
15.5
12.7
2.9
2.5
17.0
17.2
-
-
FMCG
Asian Paints
Neutral
958
-
91,930
17,128
18,978
16.8
16.4
19.1
20.7
50.2
46.3
17.5
16.5
34.8
35.5
5.3
4.8
Britannia
Buy
3,005
3,626
36,055
9,594
11,011
14.6
14.9
80.3
94.0
37.4
32.0
15.4
11.9
41.2
-
3.6
3.1
Colgate
Accumulate
939
995
25,550
4,605
5,149
23.4
23.4
23.8
26.9
39.5
34.9
21.9
17.1
64.8
66.8
5.5
4.9
Dabur India
Accumulate
277
304
48,763
8,315
9,405
19.8
20.7
8.1
9.2
34.2
30.1
9.5
7.9
31.6
31.0
5.5
4.8
GlaxoSmith Con*
Neutral
5,074
-
21,341
4,350
4,823
21.2
21.4
179.2
196.5
28.3
25.8
7.5
6.4
27.1
26.8
4.3
3.8
Godrej Consumer
Neutral
1,410
-
48,017
10,235
11,428
18.4
18.6
41.1
44.2
34.3
31.9
7.6
6.4
24.9
24.8
4.8
4.2
HUL
Neutral
834
-
180,498
35,252
38,495
17.8
17.8
20.7
22.4
40.4
37.3
38.6
33.1
95.6
88.9
5.0
4.5
ITC
Buy
231
284
279,077
40,059
44,439
38.3
39.2
9.0
10.1
25.8
22.8
7.2
6.3
27.8
27.5
6.5
5.8
Marico
Buy
249
300
32,074
6,430
7,349
18.8
19.5
6.4
7.7
38.8
32.3
11.7
9.9
33.2
32.5
4.8
4.1
Nestle*
Neutral
6,271
-
60,461
10,073
11,807
20.7
21.5
124.8
154.2
50.3
40.7
20.6
18.6
34.8
36.7
5.8
4.9
Tata Global
Neutral
122
-
7,697
8,675
9,088
9.8
9.8
7.4
8.2
16.5
14.9
1.9
1.8
7.9
8.1
0.8
0.8
Procter & Gamble
Accumulate
6,600
7,369
21,424
2,939
3,342
23.2
23.0
146.2
163.7
45.1
40.3
101.1
96.9
25.3
23.5
6.8
5.9
Hygiene
Stock Watch
November 30, 2016
Company Name
Reco
CMP
Target
Mkt Cap
Sales ( Čcr )
OPM(%)
EPS (Č)
PER(x)
P/BV(x)
RoE(%)
EV/Sales(x)
(Č)
Price ( Č)
( Č cr )
FY17E FY18E
FY17E
FY18E
FY17E
FY18E
FY17E
FY18E
FY17E
FY18E
FY17E
FY18E
FY17E
FY18E
IT
HCL Tech^
Buy
806
1,000
113,658
49,242
57,168
20.5
20.5
55.7
64.1
14.5
12.6
2.9
2.3
20.3
17.9
2.2
1.8
Infosys
Buy
973
1,249
223,412
68,350
77,326
27.0
27.0
62.5
69.4
15.6
14.0
3.3
3.0
21.3
21.6
2.7
2.3
TCS
Buy
2,258
2,620
445,001
119,025
133,308
27.6
27.6
131.2
145.5
17.2
15.5
5.6
5.1
32.4
33.1
3.5
3.1
Tech Mahindra
Buy
484
600
46,992
29,673
32,937
15.5
17.0
32.8
39.9
14.8
12.1
2.9
2.5
19.6
20.7
1.3
1.1
Wipro
Buy
464
590
112,847
55,440
60,430
18.1
18.1
35.9
39.9
12.9
11.6
2.3
2.1
19.0
19.3
1.7
1.6
Media
D B Corp
Neutral
365
-
6,707
2,297
2,590
27.4
28.2
21.0
23.4
17.4
15.6
4.1
3.5
23.7
23.1
2.7
2.3
HT Media
Neutral
72
-
1,664
2,693
2,991
12.6
12.9
7.9
9.0
9.1
7.9
0.8
0.7
7.8
8.3
0.2
0.1
Jagran Prakashan
Buy
172
225
5,616
2,355
2,635
28.0
28.0
10.8
12.5
15.9
13.8
3.5
3.0
21.7
21.7
2.4
2.1
Sun TV Network
Neutral
465
-
18,333
2,850
3,265
70.1
71.0
26.2
30.4
17.8
15.3
4.5
4.0
24.3
25.6
6.0
5.1
Hindustan Media
Neutral
272
-
1,993
1,016
1,138
24.3
25.2
27.3
30.1
10.0
9.0
1.9
1.7
16.2
15.8
1.3
1.1
Ventures
TV Today Network
Buy
310
385
1,849
637
743
27.5
27.5
18.4
21.4
16.9
14.5
2.9
2.5
17.4
17.2
2.5
2.1
Metals & Mining
Coal India
Neutral
309
-
194,860
84,638
94,297
21.4
22.3
24.5
27.1
12.6
11.4
5.2
5.0
42.6
46.0
1.8
1.6
Hind. Zinc
Neutral
282
-
119,154
14,252
18,465
55.9
48.3
15.8
21.5
17.9
13.1
2.9
2.5
17.0
20.7
8.4
6.5
Hindalco
Neutral
175
-
36,230
107,899
112,095
7.4
8.2
9.2
13.0
19.1
13.5
0.9
0.9
4.8
6.6
0.9
0.8
JSW Steel
Neutral
1,703
-
41,164
53,201
58,779
16.1
16.2
130.6
153.7
13.0
11.1
1.8
1.5
14.0
14.4
1.5
1.3
NMDC
Neutral
121
-
38,378
6,643
7,284
44.4
47.7
7.1
7.7
17.1
15.8
1.5
1.4
8.8
9.2
3.5
3.2
SAIL
Neutral
51
-
21,002
47,528
53,738
(0.7)
2.1
(1.9)
2.6
19.6
0.6
0.5
(1.6)
3.9
1.3
1.2
Vedanta
Neutral
229
-
67,758
71,744
81,944
19.2
21.7
13.4
20.1
17.1
11.4
1.5
1.3
8.4
11.3
1.3
1.0
Tata Steel
Neutral
409
-
39,728
121,374
121,856
7.2
8.4
18.6
34.3
22.0
11.9
1.4
1.3
6.1
10.1
1.0
0.9
Oil & Gas
Cairn India
Neutral
248
-
46,459
9,127
10,632
4.3
20.6
8.8
11.7
28.2
21.2
0.9
0.9
3.3
4.2
6.6
5.4
GAIL
Neutral
428
-
54,284
56,220
65,198
9.3
10.1
27.1
33.3
15.8
12.9
1.4
1.3
9.3
10.7
1.2
1.0
ONGC
Neutral
285
-
243,575
137,222
152,563
15.0
21.8
19.5
24.1
14.6
11.8
1.3
1.2
8.5
10.1
2.1
1.8
Indian Oil Corp
Neutral
299
-
145,046
373,359
428,656
5.9
5.5
54.0
59.3
5.5
5.0
0.9
0.8
16.0
15.6
0.5
0.5
Reliance Industries
Neutral
996
-
322,899
301,963
358,039
12.1
12.6
87.7
101.7
11.4
9.8
1.2
1.1
10.7
11.3
1.5
1.3
Pharmaceuticals
Alembic Pharma
Neutral
650
-
12,254
3,483
4,083
20.2
21.4
24.3
30.4
26.8
21.4
6.1
4.9
25.5
25.3
3.5
2.9
Aurobindo Pharma
Buy
740
877
43,311
15,720
18,078
23.7
23.7
41.4
47.3
17.9
15.7
4.7
3.6
29.6
26.1
3.0
2.6
Sanofi India*
Neutral
4,360
-
10,041
2,277
2,597
17.3
18.3
149.4
172.0
29.2
25.4
4.8
3.9
25.1
28.8
4.1
3.3
Cadila Healthcare
Neutral
398
-
40,745
10,429
12,318
22.6
22.0
16.9
19.2
23.6
20.7
6.0
4.8
28.5
25.7
3.9
3.2
Cipla
Reduce
569
490
45,731
15,378
18,089
17.4
18.4
21.6
27.2
26.4
20.9
3.4
3.0
13.7
15.2
3.2
2.6
Stock Watch
November 30, 2016
Company Name
Reco
CMP
Target
Mkt Cap
Sales ( Čcr )
OPM(%)
EPS (Č)
PER(x)
P/BV(x)
RoE(%)
EV/Sales(x)
(Č)
Price ( Č)
( Č cr )
FY17E FY18E
FY17E
FY18E
FY17E
FY18E
FY17E
FY18E
FY17E
FY18E
FY17E
FY18E
FY17E
FY18E
Pharmaceuticals
Dr Reddy's
Neutral
3,191
-
52,872
16,043
18,119
20.8
22.4
112.4
142.9
28.4
22.3
3.8
3.3
14.1
15.9
3.3
2.9
Dishman Pharma
Neutral
239
-
3,859
1,718
1,890
22.7
22.8
9.5
11.3
25.2
21.2
2.4
2.2
10.1
10.9
2.7
2.4
GSK Pharma*
Neutral
2,686
-
22,755
3,000
3,312
15.4
20.6
46.5
60.8
57.8
44.2
13.9
13.8
26.3
30.6
7.3
6.7
Indoco Remedies
Reduce
267
240
2,465
1,112
1,289
16.2
18.2
11.6
16.0
23.1
16.7
3.7
3.1
17.0
20.1
2.3
2.0
Ipca labs
Accumulate
566
613
7,145
3,303
3,799
15.3
15.3
17.3
19.7
32.7
28.8
2.9
2.6
9.1
9.4
2.3
2.0
Lupin
Buy
1,517
1,809
68,395
15,912
18,644
26.4
26.7
58.1
69.3
26.1
21.9
5.1
4.2
21.4
20.9
4.4
3.6
Sun Pharma
Buy
706
847
169,985
31,129
35,258
32.0
32.9
30.2
35.3
23.4
20.0
3.8
3.1
20.0
20.1
5.0
4.2
Power
Tata Power
Neutral
72
-
19,541
36,916
39,557
17.4
27.1
5.1
6.3
14.2
11.5
1.3
1.2
9.0
10.3
1.5
1.4
NTPC
Neutral
163
-
134,525
86,605
95,545
17.5
20.8
11.8
13.4
13.8
12.2
1.4
1.3
10.5
11.1
2.9
2.9
Power Grid
Neutral
190
-
99,374
25,763
29,762
74.3
73.1
14.8
17.3
12.8
11.0
2.0
1.8
16.9
17.5
8.1
7.7
Real Estate
MLIFE
Buy
374
522
1,535
1,152
1,300
22.7
24.6
29.9
35.8
12.5
10.5
0.9
0.9
7.6
8.6
2.0
1.7
Telecom
Bharti Airtel
Neutral
324
-
129,596
105,086
114,808
34.5
34.7
12.2
16.4
26.6
19.8
1.8
1.7
6.8
8.4
2.1
1.9
Idea Cellular
Neutral
79
-
28,500
40,133
43,731
37.2
37.1
6.4
6.5
12.4
12.2
1.0
1.0
8.2
7.6
1.7
1.5
zOthers
Abbott India
Neutral
4,876
-
10,361
3,153
3,583
14.1
14.4
152.2
182.7
32.0
26.7
157.3
134.3
25.6
26.1
3.0
2.6
Bajaj Electricals
Buy
217
274
2,188
4,801
5,351
5.7
6.2
10.4
13.7
20.8
15.8
2.6
2.3
12.4
14.5
0.5
0.4
Finolex Cables
Neutral
407
-
6,225
2,883
3,115
12.0
12.1
14.2
18.6
28.7
21.9
15.3
13.3
15.8
14.6
1.9
1.7
Goodyear India*
Neutral
733
-
1,690
1,598
1,704
10.4
10.2
49.4
52.6
14.8
13.9
68.5
60.1
18.2
17.0
0.7
103.6
Hitachi
Neutral
1,373
-
3,732
2,081
2,433
8.8
8.9
33.4
39.9
41.1
34.4
33.2
27.6
22.1
21.4
1.8
1.5
Jyothy Laboratories
Neutral
342
-
6,209
1,440
2,052
11.5
13.0
8.5
10.0
40.2
34.2
9.7
9.0
18.6
19.3
4.6
3.2
Page Industries
Neutral
12,694
-
14,159
2,450
3,124
20.1
17.6
299.0
310.0
42.5
41.0
282.7
215.8
47.1
87.5
5.8
4.6
Relaxo Footwears
Neutral
418
-
5,017
2,085
2,469
9.2
8.2
7.6
8.0
55.3
52.6
21.4
18.3
17.9
18.8
2.5
2.1
Siyaram Silk Mills
Accumulate
1,219
1,605
1,143
1,733
1,948
11.6
11.7
96.6
114.7
12.6
10.6
1.9
1.7
15.3
15.7
0.9
0.8
Styrolution ABS India*
Neutral
594
-
1,045
1,440
1,537
9.2
9.0
40.6
42.6
14.6
13.9
37.4
34.0
12.3
11.6
0.7
0.6
TVS Srichakra
Neutral
3,438
-
2,633
2,304
2,614
13.7
13.8
231.1
266.6
14.9
12.9
386.3
304.2
33.9
29.3
1.1
1.0
HSIL
Neutral
289
-
2,090
2,384
2,515
15.8
16.3
15.3
19.4
18.9
14.9
18.8
16.2
7.8
9.3
1.0
1.0
Kirloskar Engines India
Neutral
323
-
4,677
2,554
2,800
9.9
10.0
10.5
12.1
30.8
26.7
12.9
12.2
10.7
11.7
1.5
1.3
Ltd
M M Forgings
Neutral
425
-
512
546
608
20.4
20.7
41.3
48.7
10.3
8.7
58.2
51.5
16.6
17.0
0.8
0.7
Banco Products (India)
Neutral
193
-
1,377
1,353
1,471
12.3
12.4
14.5
16.3
13.3
11.8
18.3
16.5
14.5
14.6
1.0
102.6
Competent Automobiles Neutral
158
-
97
1,137
1,256
3.1
2.7
28.0
23.6
5.6
6.7
30.4
27.5
14.3
11.5
0.1
0.1
Stock Watch
November 30, 2016
Company Name
Reco
CMP
Target
Mkt Cap
Sales ( Čcr )
OPM(%)
EPS (Č)
PER(x)
P/BV(x)
RoE(%)
EV/Sales(x)
(Č)
Price ( Č)
( Č cr )
FY17E
FY18E
FY17E
FY18E
FY17E
FY18E
FY17E
FY18E
FY17E
FY18E
FY17E
FY18E
FY17E
FY18E
zOthers
Nilkamal
Neutral
1,380
-
2,060
1,995
2,165
10.7
10.4
69.8
80.6
19.8
17.1
78.9
68.5
16.6
16.5
1.0
0.9
Visaka Industries
Neutral
197
-
313
1,051
1,138
10.3
10.4
21.0
23.1
9.4
8.5
25.3
23.7
9.0
9.2
0.6
0.5
Transport Corporation of
Neutral
176
-
1,350
2,671
2,911
8.5
8.8
13.9
15.7
12.7
11.3
1.7
1.6
13.7
13.8
0.6
0.6
India
Elecon Engineering
Neutral
52
-
567
1,482
1,660
13.7
14.5
3.9
5.8
13.4
9.0
3.1
2.9
7.8
10.9
0.7
0.6
Surya Roshni
Neutral
200
-
879
3,342
3,625
7.8
7.5
17.3
19.8
11.6
10.2
22.0
17.7
10.5
10.8
0.5
0.5
MT Educare
Neutral
116
-
460
366
417
17.7
18.2
9.4
10.8
12.3
10.7
2.7
2.4
22.2
22.3
1.2
1.0
Radico Khaitan
Buy
117
147
1,555
1,667
1,824
13.0
13.2
6.7
8.2
17.6
14.3
1.6
1.5
9.0
10.2
1.3
1.2
Garware Wall Ropes
Neutral
622
-
1,361
873
938
14.3
14.3
35.2
37.5
17.7
16.6
3.1
2.6
17.5
15.9
1.5
1.4
Wonderla Holidays
Neutral
337
-
1,901
287
355
38.0
40.0
11.3
14.2
29.8
23.7
4.3
3.7
21.4
23.9
6.3
5.1
Linc Pen & Plastics
Neutral
235
-
347
382
420
9.3
9.5
13.5
15.7
17.5
15.0
3.0
2.6
17.1
17.3
1.0
0.9
The Byke Hospitality
Neutral
175
-
700
287
384
20.5
20.5
7.6
10.7
23.0
16.3
4.8
3.9
20.7
23.5
2.5
1.8
Interglobe Aviation
Neutral
875
-
31,515
21,122
26,005
14.5
27.6
110.7
132.1
7.9
6.6
47.3
33.8
168.5
201.1
1.5
1.1
Coffee Day Enterprises
Neutral
205
-
4,221
2,964
3,260
20.5
21.2
4.7
8.0
-
25.6
2.4
2.2
5.5
8.5
1.8
1.6
Ltd
Navneet Education
Neutral
108
-
2,575
1,062
1,147
24.0
24.0
6.1
6.6
17.8
16.3
3.7
3.2
20.6
19.8
2.5
2.3
Navkar Corporation
Buy
172
265
2,459
408
612
42.9
42.3
6.8
11.5
25.5
15.0
1.8
1.6
6.9
10.5
6.9
4.6
UFO Moviez
Neutral
442
-
1,220
619
685
33.2
33.4
30.0
34.9
14.8
12.7
2.0
1.8
13.8
13.9
1.7
1.3
VRL Logistics
Neutral
269
-
2,456
1,902
2,119
16.7
16.6
14.6
16.8
18.5
16.0
4.1
3.6
21.9
22.2
1.4
1.2
Team Lease Serv.
Neutral
852
-
1,457
3,229
4,001
1.5
1.8
22.8
32.8
37.4
25.9
4.0
3.5
10.7
13.4
0.4
0.3
S H Kelkar & Co.
Neutral
302
-
4,361
1,036
1,160
15.1
15.0
6.1
7.2
49.4
42.0
5.3
4.8
10.7
11.5
4.1
3.6
Quick Heal
Neutral
232
-
1,628
408
495
27.3
27.0
7.7
8.8
30.0
26.4
2.8
2.8
9.3
10.6
3.1
2.6
Narayana Hrudaya
Neutral
341
-
6,975
1,873
2,166
11.5
11.7
2.6
4.0
129.0
86.1
7.9
7.2
6.1
8.3
3.8
3.3
Manpasand Bever.
Neutral
626
-
3,580
836
1,087
19.6
19.4
16.9
23.8
37.1
26.3
4.4
3.9
12.0
14.8
4.0
3.0
Parag Milk Foods
Neutral
271
-
2,280
1,919
2,231
9.3
9.6
9.5
12.9
28.7
21.0
4.5
3.7
15.5
17.5
1.3
1.1
Mirza International
Buy
81
107
973
987
1,106
18.0
18.0
6.5
7.6
12.4
10.6
2.0
1.7
15.9
15.7
1.2
1.1
Asian Granito
Buy
210
351
630
1,071
1,182
12.1
12.4
12.7
16.0
16.5
13.1
1.6
1.4
9.5
10.7
0.9
0.8
Source: Company, Angel Research; Note: *December year end; #September year end; &October year end; Price as on November 30, 2016
Market Outlook
November 30, 2016
Research Team Tel: 022 - 39357800
DISCLAIMER
Angel Broking Private Limited (hereinafter referred to as “Angel”) is a registered Member of National Stock Exchange of India
Limited,Bombay Stock Exchange Limited and Metropolitan Stock Exchange Limited. It is also registered as a Depository Participant with
CDSL and Portfolio Manager with SEBI. It also has registration with AMFI as a Mutual Fund Distributor. Angel Broking Private Limited is a
registered entity with SEBI for Research Analyst in terms of SEBI (Research Analyst) Regulations, 2014 vide registration number
INH000000164. Angel or its associates has not been debarred/ suspended by SEBI or any other regulatory authority for accessing
/dealing in securities Market. Angel or its associates/analyst has not received any compensation / managed or
co-managed public offering of securities of the company covered by Analyst during the past twelve months.
This document is solely for the personal information of the recipient, and must not be singularly used as the basis of any investment
decision. Nothing in this document should be construed as investment or financial advice. Each recipient of this document should make
such investigations as they deem necessary to arrive at an independent evaluation of an investment in the securities of the companies
referred to in this document (including the merits and risks involved), and should consult their own advisors to determine the merits and
risks of such an investment.
Reports based on technical and derivative analysis center on studying charts of a stock's price movement, outstanding positions and
trading volume, as opposed to focusing on a company's fundamentals and, as such, may not match with a report on a company's
fundamentals. Investors are advised to refer the Fundamental and Technical Research Reports available on our website to evaluate the
contrary view, if any.
The information in this document has been printed on the basis of publicly available information, internal data and other reliable
sources believed to be true, but we do not represent that it is accurate or complete and it should not be relied on as such, as this
document is for general guidance only. Angel Broking Pvt. Limited or any of its affiliates/ group companies shall not be in any way
responsible for any loss or damage that may arise to any person from any inadvertent error in the information contained in this report.
Angel Broking Pvt. Limited has not independently verified all the information contained within this document. Accordingly, we cannot
testify, nor make any representation or warranty, express or implied, to the accuracy, contents or data contained within this document.
While Angel Broking Pvt. Limited endeavors to update on a reasonable basis the information discussed in this material, there may be
regulatory, compliance, or other reasons that prevent us from doing so.
This document is being supplied to you solely for your information, and its contents, information or data may not be reproduced,
redistributed or passed on, directly or indirectly.
Neither Angel Broking Pvt. Limited, nor its directors, employees or affiliates shall be liable for any loss or damage that may arise from
or in connection with the use of this information.